
Beth Ann Rosica: It will take more than money to solve Pennsylvania’s education crisis
Introduction
Four years since the first pandemic school closures in March 2020, we are faced with the unavoidable conclusion that public education in America is broken.
Academic performance and attendance are at all-time lows in many districts across the country, while mental health issues, behavioral incidents, and school violence are exponentially on the rise. Last year, the New York Times, the Washington Post, NPR, and most national news outlets reported that academic achievement continues to decline since schools were closed.
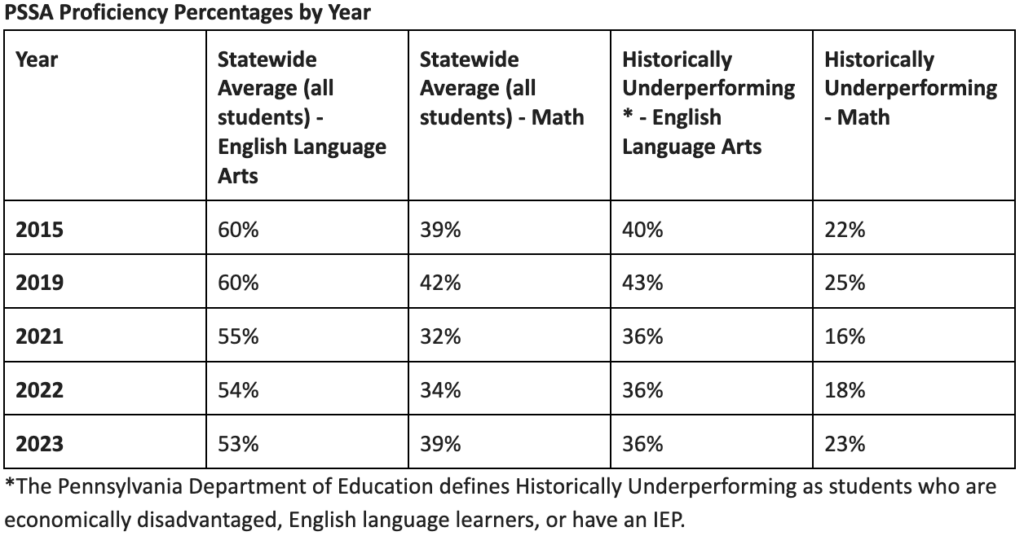
In Pennsylvania and elsewhere, many of these trends and issues started before the extended school closures but were exacerbated when children were locked out of school. The chart below shows the Pennsylvania System of School Assessment (PSSA) results from 2015 to 2023. Prior to lockdowns, approximately 60 percent of Pennsylvania students were proficient in English Language Arts (ELA) with small variations year over year. Math proficiency followed a similar pattern with approximately 42 percent of students.
While those averages were nothing to celebrate, results for historically underperforming students were much worse.
The Pennsylvania Department of Education (PDE) defines Historically Underperforming as students who are economically disadvantaged, English language learners, or have an Individualized Education Plan (IEP). These students averaged proficiency rates of barely 42 percent in ELA and 24 percent in Math prior to 2020.
These trends show that our most vulnerable students were already far behind before the extended school closures, and the rest of the student population was not performing at acceptable levels. While math scores are beginning to rebound, they are still woefully short of reasonable progress, and ELA scores continue to trend downward for all students on average.
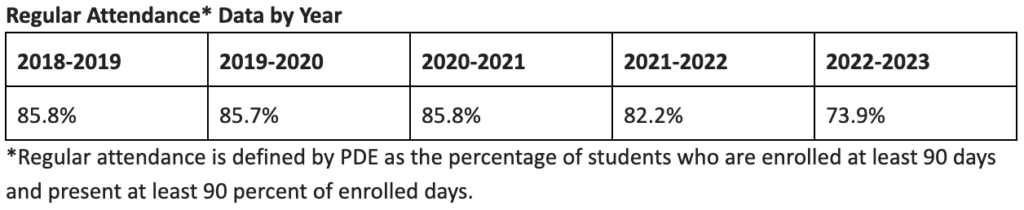
In Pennsylvania, regular attendance at school is also a significant problem. Children cannot learn if they don’t attend classes. The chart below shows the percentage of students who maintain regular attendance across the state. Regular attendance is defined by PDE as the percentage of students who are enrolled at least 90 days and present at least 90 percent of enrolled days.
The minimum number of days required by law is 180; therefore, in order to be counted as regular attendance, a student must attend at least 162 days. Students below the regular attendance threshold are missing at least eighteen or more days every school year.
Again, the averages were less than ideal prior to school closures with only 85 percent of students attending at least 90 percent of the time, but after a return to the classroom, the numbers started dropping, with a significant reduction in regular attendance last year.
Based on the data, Pennsylvania public education is neither meeting the needs of a vast majority of students, nor is it preparing students for postsecondary school or employment.
School Funding
Last year, Commonwealth Court Judge Renée Cohn Jubelirer ruled that the current funding system for public schools is unconstitutional. The court charged the legislature to develop a new, more equitable system. The Basic Education Funding Commission, a bipartisan committee of fifteen members convened last May and subsequently developed two reports to address the issue.
The committee was composed of three House Democrats, three House Republicans, three Senate Democrats, three Senate Republicans, and three members of the Governor’s administration. The “majority” report which was the one presented as the final report was supported by all House and Senate Democrats with the exception of Senator Lindsey Williams from Allegheny County. All three members from Shapiro’s administration also voted yes to the majority report. The “minority” report received support from all six House and Senate Republicans, and the administrative staff abstained from that vote.
The two reports had very similar recommendations, including proposed changes to the funding formula, and a focus on construction upgrades, school safety, education workforce development, career and technical education, and student support services, i.e. tutoring. Senator David Argall, a Republican and chair of the Education committee, explained the differences between the adopted and rejected reports. “The Democrats were very specific about how much money should be allocated for the recommendations. The Republicans were reluctant to do that because it is up to the entire legislature to make those decisions.”
Argall also noted that property tax reform was a key difference between the Democrat and Republican reports. “We need a firmer grasp on the state tax receipts to determine if the projections are realistic versus phony.” The Senator also said that the Republicans were very concerned about draining the rainy day fund to pay for all the specific recommendations because no one seems to have answers about how the funding will continue after the fund is depleted. He said that without the rainy day fund, the recommendations could result in the largest tax increases in state history.
The real question is whether additional funding will actually address the problem. What does “equitable funding” look like? Does it mean that we spend the same amount of money on every child? This is not likely due to demographic and cost of living differences across a diverse state comprising urban, suburban, and rural school districts. The end goal should not be “equitable funding,” but rather “equitable opportunities.” The work should be focused on improving academic outcomes for students across the Commonwealth, but the reality is that increased funding is not likely the answer.
Family Matters
As mentioned in yesterday’s article by Wally Nunn, economist Melissa S. Kearney has written extensively on the subject of families and success in her book, The Two-Parent Privilege, Kearney makes the argument that it is imperative to discuss the impact of single-parent homes on children and their subsequent academic outcomes. The book is not judgemental, in fact, quite the contrary, it provides data and research in an unbiased manner to allow for discussion and examination. “A child living with an unmarried parent, on average, has access to fewer resources during their childhood – a time in life when resources really matter.” (p. 43)
Anyone with children knows the truth of this statement. By and large, when it comes to parenting, two is better than one, both from an emotional and financial standpoint. Kearney explains how marriage rates have been falling since the 1960’s and 1970’s and those without a college degree are less likely to get married than those with a degree. And men without a college degree are far more likely to be absent from parenting than those men with a college degree.
She concludes that children’s outcomes are significantly impacted by their family and home experiences. “Children who have the benefit of two parents in their home tend to have more highly resourced, enriching, stable childhoods, and they consequently do better in school and have fewer behavioral challenges. These children go on to complete more years of education, earn more in the workforce, and have a greater likelihood of being married. Of course, these are not the only measures of a successful life, but they are useful metrics of achievement and well-being. The data tell a clear story: family matters.” (p. 169)
There will no doubt be pushback from readers about the sensitive nature of the topic. Neither the book, nor this article, intend to judge any family situation or suggest that there are no anomalies in the data. However, the data is clear that the decline in marriage and ensuing two-parent families is creating more challenges for schools, teachers, and administrators.
While marriage rates are also low in some other countries, particularly in Europe, cohabitation is much different. In Europe, many couples cohabitate for life. The author states that those relationships function similar to marriage in the United States. Here, cohabitation is transitory and not the same as in Europe. Our situation is uniquely harmful.
In order to develop effective solutions to the crisis in public education, we must first fully understand the problem, even at the risk of giving unintended offense.
Local Analysis
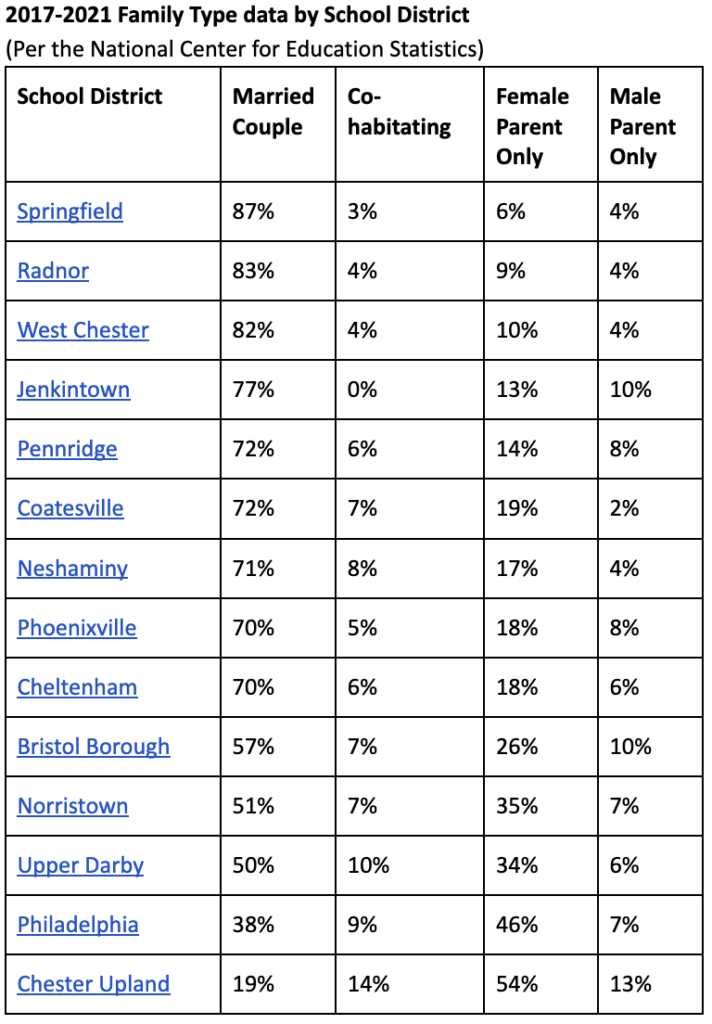
In order to test Kearney’s conclusions in southeastern Pennsylvania, we selected a total of fourteen diverse local districts to analyze similar data to determine if there is a relationship between culture and academic achievement. Included in the analysis are two adjacent districts, Upper Darby and Springfield, that show dramatic differences in family type and academic achievement.
The National Center for Education Statistics (NCES) provides demographic and geographic estimates by school district. To see the details for each district, click on the link with the district name. The data below is estimated from 2017-2021 and details the family type percentages for each district. The data is slightly skewed, though, because it includes all residents in the district, not just those with school-aged children, but it is the best data available to us.
In January, we reported about the disparity of academic outcomes between students at Upper Darby and Springfield middle schools. Based on the family structure data, 87 percent of families in the Springfield School District are married families; whereas, only 50 percent of Upper Darby families are married. All of Springfield’s assessment scores were well above the state averages while all of Upper Darby’s scores were well below the state average.
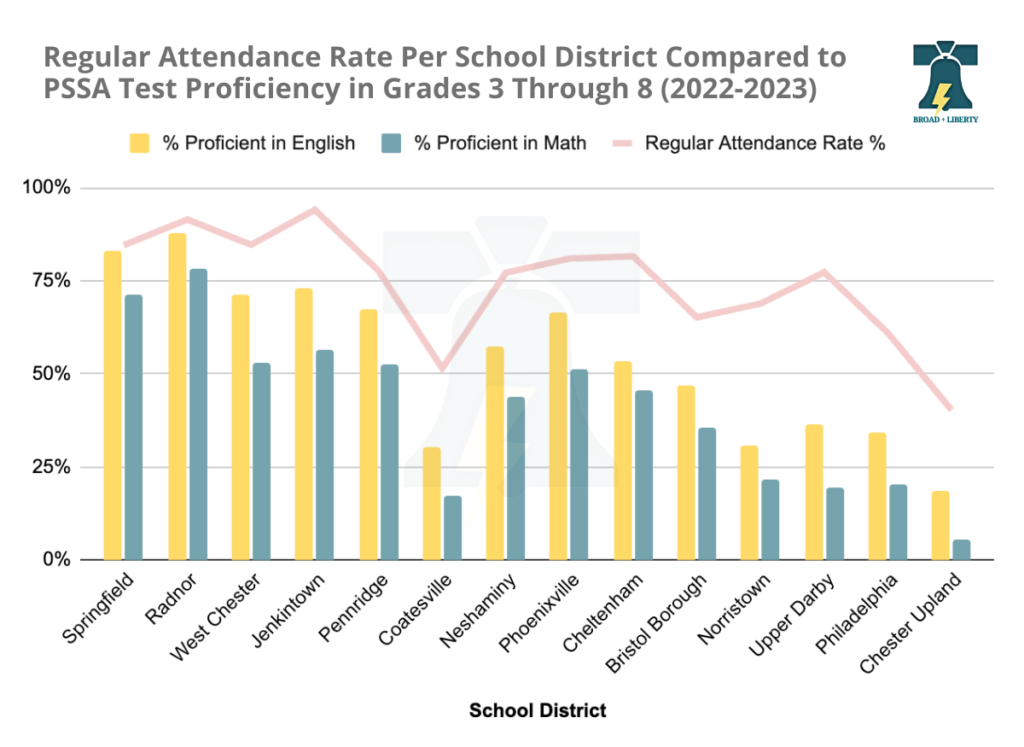
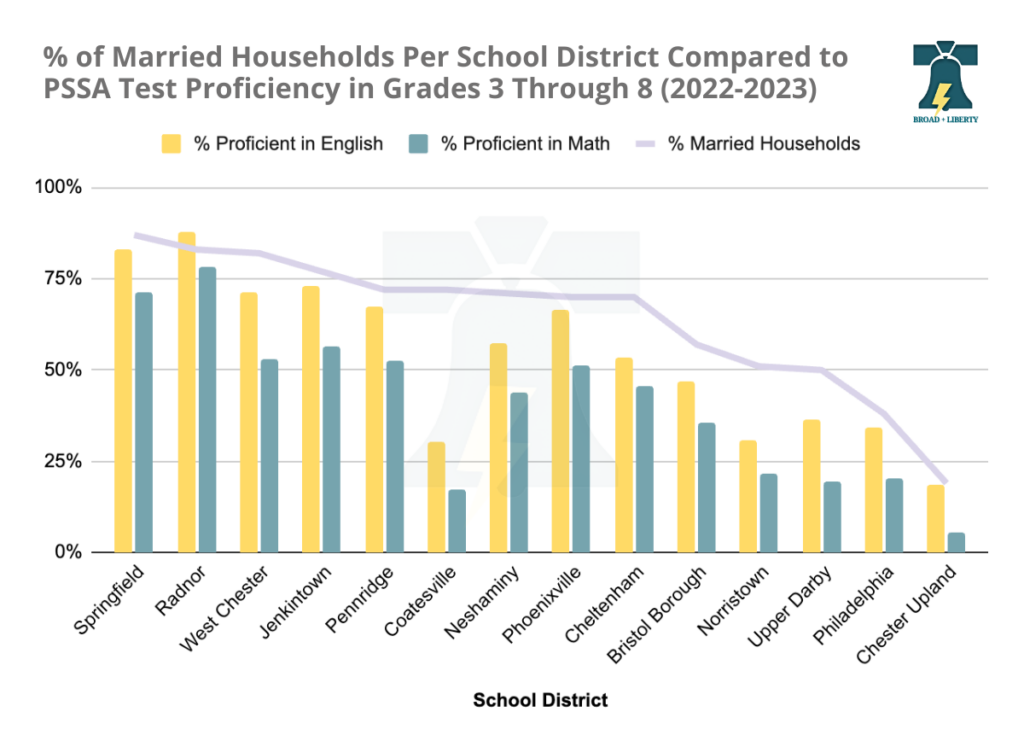
The charts below show each district’s 2023 PSSA assessment scores with regular attendance rate and also with married family percentage. The PSSAs are administered in grades three through eight in English Language Arts and mathematics and the scores below are aggregated. Regular attendance is defined as students who attend at least 90 percent of the school days with most districts providing 180 days of instruction.
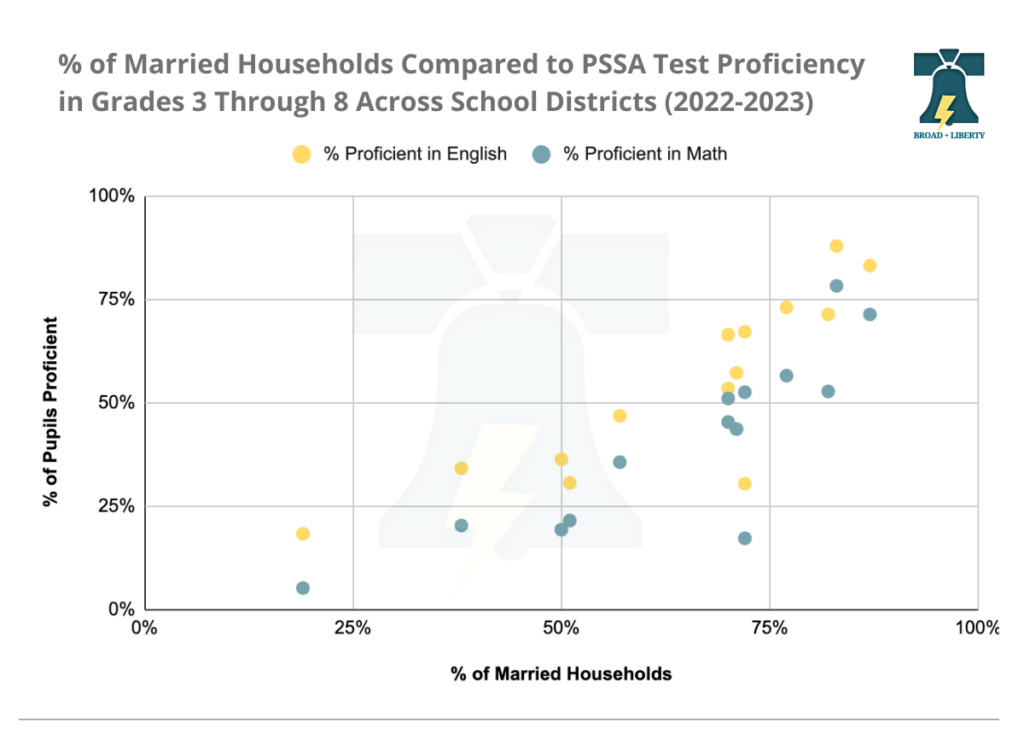
For the most part, the data from the chart is consistent with the findings from the author. For districts with a married family percentage above 72 percent, all academic indicators are above the state average. Those districts include Radnor, Springfield, Jenkintown, West Chester, and Pennridge.
Conversely, for those districts with a married family percentage below 60 percent, all academic assessments are below the state average, including Bristol Borough, Upper Darby, Philadelphia, Norristown, and Chester Upland. Phoenixville, Neshaminy, and Cheltenham have mixed results above and below the state average with a 70 to 72 percentage of married families. The one significant anomaly is Coatesville Area School District. Despite a 72 percent married family rate, all academic indicators are well below the state average. Maybe there are higher numbers of students in charter or private schools, but this clearly warrants further investigation.
Fiscal Analysis – spending versus outcomes
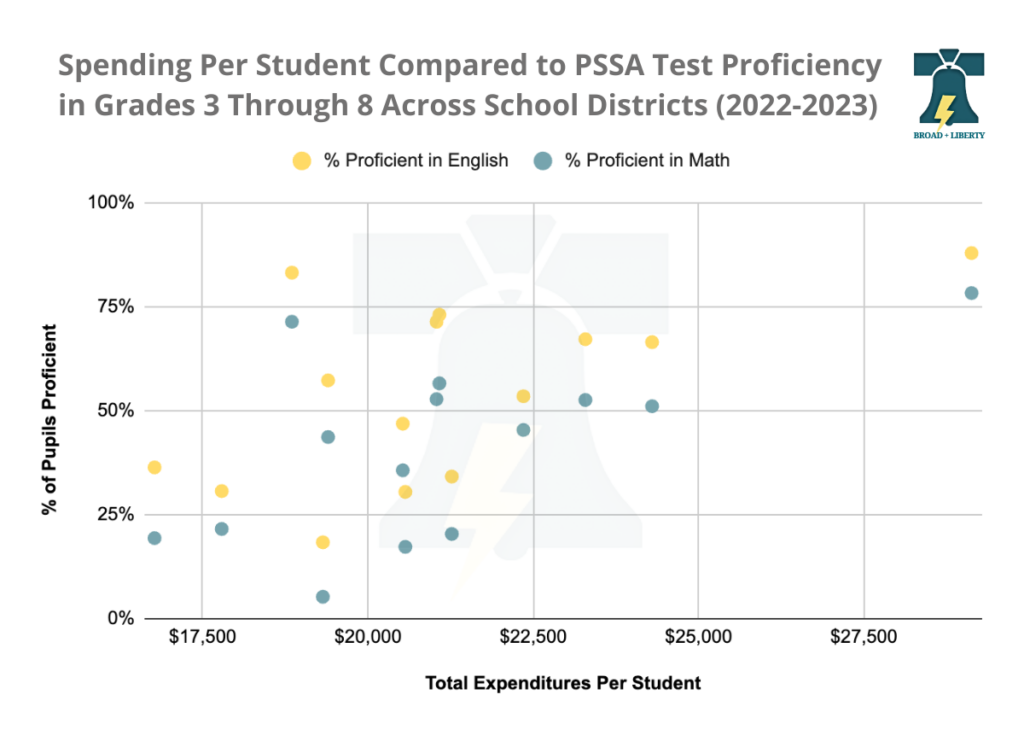
The following chart shows the total expenditures per student for the 2021-2022 school year by district. (The most recent data from the state.) The Annual Financial Report (AFR) by district breaks out total expenditures and specific line item expenses. We calculated the cost per student using the state Average Daily Membership (ADM) numbers. ADM is the term used for all resident pupils of the school district for whom the school district is financially responsible and is calculated by dividing the aggregate days membership for all children on active rolls by the number of days the school district is in session.
The data shows that total expenditures per pupil range from roughly $17,000 to $29,000 annually. When comparing this data to family type and PSSA scores, there are four districts that are spending over $20,000 annually per student, have a high percentage of married families, and test scores above the state average. Radnor, Jenkintown, West Chester, and Pennridge hit those measures. Possibly there is a relationship between per student spending and the percentage of married families in a district.
However, there are also outliers in the group, notably Springfield. This Delaware County school district has the highest percentage of married families, the second highest test scores, and a lower spending per student at $18,850. Contrast Radnor spending over $29,000 per student with Springfield spending over $10,000 less per student. Despite this large gap, the academic achievement numbers are virtually the same.
Furthermore, three of the districts spending over $20,000 annually per student have significantly low test scores. Philadelphia, Coatesville, and Bristol Borough school districts are not seeing a return on their investment in terms of academic achievement. Two of the districts have lower married family percentages. Coatesville is the outlier here with higher spending, high married family percentage, and low test scores. However, two of the districts spending over $20,000 annually — Cheltenham and Phoenixville — have close to the state average test scores and 70 percent married families.
Based on the data, there does not seem to be a strong correlation between total spending per student and academic achievement. The more notable relationship appears to be the percentage of married families. Further analysis is clearly warranted.
Will increased funding fix the current problem?
Based on the Basic Education Funding Commission’s report, Governor Shapiro proposed a record $1 billion increase this year in education funding. This is over and above the $600 million increase granted last year. And despite the proposed increases, Shapiro remained silent on school choice options, including the Lifeline Scholarship program that he supported during his campaign.
The real question is whether the increased funding will actually fix the broken public education system. Based on the recent past, we already know that the answer is: “highly unlikely.” Indeed, over the course of the last three years, the federal government — via ARPA funding allocated to the states — has injected billions of dollars in new spending on public education. Much of this spending was over-indexed to socio-economically distressed school districts. The result? It paints a picture that is even worse. In the 2022-2023 school year, Upper Darby School District actually spent $1,237 more per student ($21,388) than Springfield School District. Yet, the number of Upper Darby students proficient in English and Math is substantially less than half that of Springfield School District.
In Pennsylvania, this unprecedented level of public school funding was facilitated by the Elementary and Secondary School Emergency Relief (ESSER) funds. The state of Pennsylvania received a total of $523.8 million in ESSER I funds in May 2020, and an additional $2.2 billion in ESSER II funds in January 2021. As aforementioned, the Pennsylvania Department of Education allocated those funds to schools with the highest need based on Title I formulas for educationally deprived children.
With all this additional funding, many students across the Commonwealth are still woefully behind academically, as the PSSA scores show minimal improvement in math and no improvement in English Language Arts. In 2023, only 39 percent of students were proficient in math and only 53 percent were proficient in English Language Arts. In 2022, 34 percent of students were proficient in math, marking a minimal increase based on the additional funding, and English Language Arts scores actually dropped from 54 percent.
The lack of significant progress and declining scores — despite the billions of dollars invested in schools — demonstrates that money is not the sole, and likely not even the most important factor to right this sinking ship. The family structure and the local community play a large role in ensuring the success of our students. Upper Darby School District continues to struggle with low academic achievement, and their superintendent, Daniel McGarry has repeatedly, publicly acknowledged that more support is needed from home. An excerpt from his latest email to parents in January 2023, explains the importance of parental involvement.
“I recognize that when I have asked for help from the community in the past, my message may have been misunderstood. My intention is not about assigning blame or establishing shame; instead, I am asking for everyone to please talk to your student. I hope we can all agree that we are not going to condone physical aggression in our schools or on the way to and from our schools. Please encourage them to make good decisions and to seek out adults and the support(s) we have in our schools if they need help.”
In the Upper Darby School District, only 50 percent of families are married. Clearly, money cannot fix or level the playing field for children who do not have the same support at home as those children with married parents, living together.
Basic Education Funding Commission recommendations
The Basic Education Funding Commission reports — both the majority and minority — call for minor tweaks to the current funding formula to address the issue of predictability. According to the reports, it is challenging for districts to manage year over year budgets when the funding can fluctuate significantly. Throughout “the long and comprehensive process that included numerous public hearings” according to Senator Argall, the committee considered hundreds of public comments and live testimony.
Dr. Sherri Smith, Executive Director, Pennsylvania Association of School Administrators (PASA) testified, “When our school leaders are asked what is most important to them in education funding, they are most concerned with the predictability and sustainability in the funds.” (page 16)
The majority report’s first recommendation was to “reduce the volatility in the basic education funding (BEF) formula by using three-year averages in certain data elements, lessening the concentrated poverty “cliff,” and resetting the base at the 2023-24 distribution level. Provide at least a $200 million increase through this updated BEF formula each year.” (page 5)
While Republican committee members generally agreed with the concept of tweaking the funding formula, they did not agree with the specific recommendation to increase by $200 million annually. As mentioned earlier, once the Rainy Day Fund is depleted, significant tax increases will be necessary to sustain the funding.
Both lengthy reports lacked specific measures to evaluate whether increased funding actually affects academic achievement. The minority report did include a statement that increased funds must include some level of accountability. “That said, when the General Assembly takes up the issue of adequacy, in our view, any additional funding that districts would receive to address adequacy gaps must include an accountability component to ensure those districts invest in programs that focus on high-quality academics for students, especially those students who are economically disadvantaged and historically Underperforming.” (page 30)
Local level solutions necessary
Ultimately, the starting and ending points for addressing the public school crisis in Pennsylvania are at the local school district level. Every community in the Commonwealth is different and faces a myriad of challenges when it comes to providing equitable access to education. Even locally, there are significant disparities between communities, even those adjacent to one another.
The process to improve academic achievement for all students can only begin and end at the local level. The issues in Upper Darby and Norristown are significantly different than the challenges in Phoenixville and Cheltenham. No two districts have the exact set of circumstances, and throwing billions of dollars at the problem won’t address the issues, especially when the funding will eventually be borne on the backs of hard-working Pennsylvanians.
What both the majority and minority reports fail to recognize is that the larger societal issues must simultaneously be addressed in order to actually impact academic achievement. Increases in funding must come with strict accountability measures and metrics for assessment to conduct a cost-benefit analysis to determine if the goals were met.
Based on the data reviewed here, a good deal of the problems are not likely solved with increased education funding. Further analyses are needed to determine the reasons for academic failure, and only then can solutions be explored.
Conclusion
While this analysis is by no means comprehensive, it does offer some insights into the larger issues facing our school districts. The extended school closures and poor policies of the former administration around Covid exacerbated a brewing crisis regarding academic achievement. The gap continues to widen for children living with two versus one parent. We understand that this is a highly sensitive issue and will likely cause discomfort.
As a side note, having worked in the human services field for over thirty years and witnessing firsthand the impacts of absent fathers on children, discussing the topic openly made me uncomfortable. I believe the reason is that none of us want to be judgemental of any family type. Additionally, most parents are doing the best they can for their children, and it is hard to state that despite their best efforts, single parent homes are not statistically able to give their children the same amount of financial and emotional support. And none of this discussion is meant to imply that there are no single parent families who are successfully supporting their children.
But as Kearney said in The Two-Parent Privilege, not discussing the data is counterproductive. We must find a way to engage in the difficult conversations with empathy and sensitivity so that we can find solutions to level the playing field.
Children do not ask to be born, nor do they have any control over who their parents are or the circumstances to which they live. Therefore, it is incumbent upon us to use our limited financial resources to address the root of the problem and not the symptom of the problem.
While teachers, administrators, and school boards have a large responsibility for academic achievement or lack thereof, we must acknowledge that there are forces outside of their control. We must address both the teaching and learning side of the equation, and we must look at the community and family circumstances. The bottom line is that the disparity in academic performance cannot be addressed solely through the schools or through exorbitant funding.
This analysis is meant to serve as a starting point, not an end point. There is much more data collection and research required before we fully understand the problem. And only then can we provide meaningful solutions and the funding to support them.
Beth Ann Rosica resides in West Chester, has a Ph.D. in Education, and has dedicated her career to advocating on behalf of at-risk children and families. She covers education issues for Broad + Liberty. Contact her at barosica@broadandliberty.com.


Dr. Rozica produces yet another data driven article that requires one to pause and think about the future for their children.
“Children do not ask to be born, nor do they have any control over who their parents are or the circumstances to which they live.”
We need leadership that can make hard decisions not by looking away from these facts, but by dismantling the current allocation of funds and rebuilding them with the child at the center.